This week I came across an article on Slashdot with the headline “IE Drops To Single-Digit Market Share“. Wow, that sure sounds like a rough ride for Internet Explorer, which used to completely dominate the web in the beginning of the 21st century. Oh how the mighty have fallen.
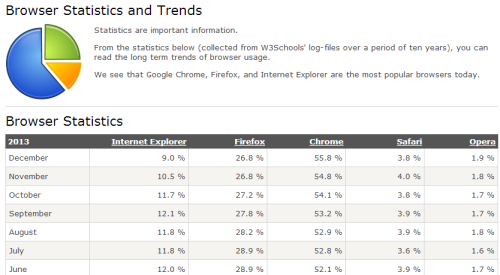
There’s only flaw with this article: what its headline suggests isn’t true. The stats referenced here were actually taken from a single website. Since the world wide web consists of hundreds of millions of websites it’s pretty obvious that the “market share” claim has a slight problem with the sample size. Anyway, I guess we could still draw some conclusions from it if this data came from a widely used website that ranks high up there in the list of most visited websites of the world. So, was it from Google, Facebook or Wikipedia by any chance?
Nope. The data was collected from a site called W3Schools, which calls itself “the largest WEB DEVELOPERS SITE on the Internet.” Okay, I’m pretty sure the site owners know how to collect browser stats then, but what I’m less sure of is that their target audience would reflect the average Internet user. Just like most people driving cars don’t actually know how to make cars nor even have an engineering degree in any other field, the people who end up consuming the content of the W3Schools website are people who make websites. If your mom & dad have ever visited W3Schools then all I can say is you have a really cool family, but unfortunately I think most other families aren’t quite up there in their geekiness level.
Lies, damn lies and website statistics
I could have just googled up some more reliable web browser market share figures and pasted them here, but that would have been a fairly boring blog post to write. Since I drop by here so rarely these days (just blame Twitter, Google+ and all the other social networks), I didn’t want to just reflect on a random Slashdot article but rather take the opportunity to learn a bit more about the topic in question. Therefore I decided to generate my own browser market share statistics.
This here blog doesn’t gather many visitors due to lack of regular content, but my other work related blog called Surviving CRM has a nice little audience of around 10k visits per month. I of course have the Google Analytics tracking script on it, which has allowed me to accumulate visitor data from the site since 2009. I had never really paid much attention to what browsers the visitors were using, but inspired by the W3Schools example, I decided to grab those stats from GA and build a chart in Excel. I picked a data range from 2010 to 2013 and summed it on a monthly level. Here are the results:
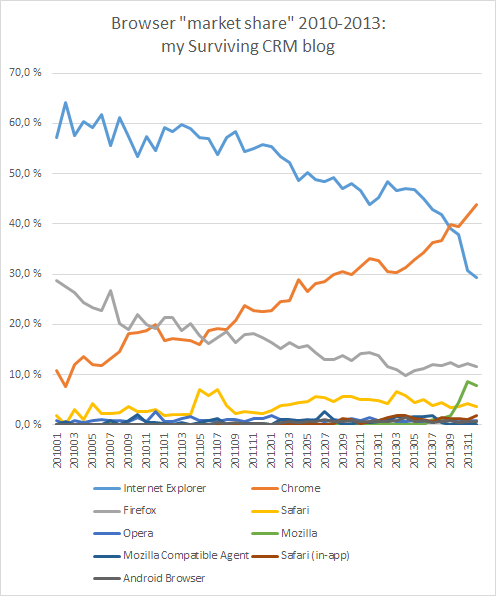
Unlike the Slashdot article, I’ll be the first to spill the beans on how the visitor demographics of this site are skewed: it’s a blog targeted at relatively tech savvy people who are working with a specific Microsoft software product (Dynamics CRM). What this means is that there won’t be quite as high rate of developers in my audience (for example, I’m not a developer myself, as in a person who would write any lines of code, or even HTML markup). There will, however, be a high share of people whose salary comes from consulting work around a product built by Microsoft, so many of them will root for software originating from Redmond as opposed to Mountain View or Cupertino.
With this in mind, the stats are in line with the overall downward trend for Internet Explorer market share. Over the past 4 years Chrome has leaped from 10% to 44% share while both IE and Firefox are in a terminal decline. Safari is holding in there with the few percentages that it has managed to claim, which is a lot more than Opera can ever dream to achieve.
September 2013 was the month when Chrome overtook IE and the gap has really opened up in the past two months. Coincidentally, we’ve also seen a huge spike for “Mozilla” browsers during the same time frame. As the latest Internet Explorer 11 identifies itself as Mozilla via the user agent, we should probably count the green graph into the IE share, which would mean the decline isn’t quite as big as the chart implies. Still, Chrome remains in the lead and if the trend continues, the gap is likely to keep on growing.
Personally I’m not at all surprised to find that Google’s browser is on the number one spot for my CRM blog. Heck, I’ve been using it as my primary browser at home for probably almost as long as the graphs above go. The user experience in the little details that you encounter during the course of the day has been better than in any competing browser. As for the performance in rendering the client heavy web apps of today, I’ve simply relied on the opinions of “web development experts” that Chrome has been a consistent performer on this front. The work related tasks and business applications still remain in my IE windows, but Chrome is the place for all the fun stuff and for using Google’s services, simply because it has been a fun browser to use.
I believe Microsoft is working hard these days on improving the bad reputation of IE and under the right circumstances it might well be a worthy competitor today. However, the experience of upgrading my Windows 8 machines to Windows 8.1 and getting the latest Internet Explorer 11 installed as a bonus (that you can’t opt out of) lead to so many encounters with websites that were incompatible with IE11 that I decided to not ditch Chrome just yet. On my Surface 2 tablet or my Lumia 1020 smartphone the only browser choice is naturally IE and I’ve not had any big issues with either one, so I have no reason for being anti-IE.
The future is mobile, right?
For many years now we’ve been catered to stories telling us how the age of the PC has come to an end and that we’re now living in the Post-PC era where every computing need we have is better fulfilled by a sleek mobile device that fits into our pocket (well, a really large pocket for tablets), has an intuitive touch screen UI, doesn’t run any of the old, clunky PC software, comes mostly in white color instead of the beige tone of ancient PCs and is built mostly from components manufactured by Samsung. Any company or person that is running a website has been instructed to de-emphasize the traditional desktop browsing thinking and instead adopt a “mobile first” mindset where the primary method of consuming web content will be via a mobile device.
This is perhaps an even bigger shift than the end of Internet Explorer’s dominance on the web, so we should definitely also study how the website visitor stats reflect the changes in choice of device. Here are the results from the Surviving CRM blog:
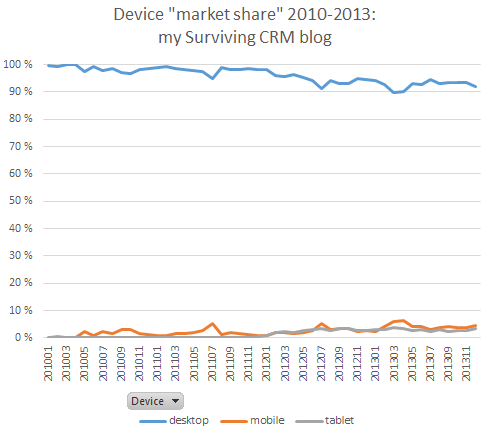
Well, that wasn’t nearly as exciting as the browser wars, now was it? Instead of a downward death slope for desktop browsing, we’re seeing only fairly moderate decline during the past 4 years. Starting from in practice a 100% share back in January 2010, the share of visitors with desktop browsers has come down to 92,2% in December 2013. Mobile browsers have at times reached a high of 6% but on average tend to remain closer to 4%. Tablets are a more recent entrant onto the scene and are not able to reach mobile’s market share on a consistent basis yet but rather occupy the 3% milestone.
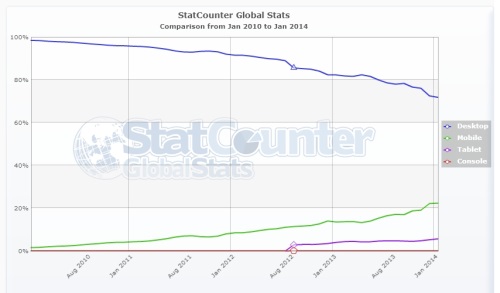
Should we call off the mobile revolution then? Probably not, but we should rather try to understand how exactly users with smartphones and tablets are consuming content. The wider market share figures for different devices, as illustrated by StatCounter below, do indicate a stronger trend in mobile browsing. You only need to keep your eyes open in public places and observe people being glued to their smartphone screens to understand that they will be doing more than just playing Angry Birds or Candy Crush Saga on these devices. Even with the onslaught of trillions of apps out there in the stores, it’s very likely that the smartphone users will frequently venture on to websites and thus appear in these visitor statistics.
For a technical blog like Surviving CRM or even W3Schools for that matter, mobile device users just aren’t the most likely audience. On a blog site the mobile traffic will quite often come from links shared on social media, which is a very common mobile use case for those tiny iPhone touch screens. Having a version of the site that is easily consumable on such a device makes perfect sense, but there isn’t much point in trying to make the content of the site fit a strict “mobile first” criteria (yet). Designing responsive websites is an art that the W3School website visitors will surely be studying quite intensively these days, yet even that study will in 97% of the cases take place on a desktop web browser. Yeah, the browser will probably run on a MacBook or some other laptop that doesn’t fit the “desktop PC” description, but it’s still consumed in the virtual desktop surroundings of the operating system.
If there’s any lesson in this little study of the changes in browser market share trends, I’d say it’s about learning the importance of one word when it comes to statistics: context. Just because a piece of statistics can be collected and visualized in a chart, that doesn’t mean any of the conclusions people draw from it should be taken at face value. The numbers may be true, but the phenomena that they describe can be something quite different that the persons quoting the statistics portray it to be. Similarly, just because a specific market trend can be observed from data collected from reliable sources, this doesn’t mean it will be globally true for all of the market segments. Use the statistics to first understand what is happening around you, then analyze the more detailed data to understand what exactly is happening to you.


0 Responses
Stay in touch with the conversation, subscribe to the RSS feed for comments on this post.